I am just coming to grips with creating notebooks (reports) in the kernel and for testing the report. When testing with MUnit there is no front end so it seems that all the Notebook manipulation commands such as:
nb = CreateDocument[]
nb = NotebookPut[]
don’t work. So my work around is to test my own notebook. This can be turned into an actual workbook easily on a FrontEnd eg:
In[3]:= nb = Notebook[{}]
Out[3]= Notebook[{}]
In[6]:= AppendNotebook[nb_, expr_] :=
Notebook[Append[nb[[1]], expr]]; nb =
AppendNotebook[nb, Cell["Hello", "Subsection"]]Out[6]= Notebook[{Cell["Hello", "Subsection"]}]
In[8]:= NotebookPut[nb]
Then you can add a grid box – I have adapted a version here which produces a box even if all the tables are not quite the right length as I would rather have a grid when the data is wonky than not:
writeNotebookGrid[nb_, body_, headerList_] :=
Module[{headings, itemsBody, cols, useBody, result},
result = AppendNotebook[nb, Cell["Table", "Subsection"]];
If[Depth[body] < 3, useBody = {{"Body parameter not deep enough"}},
useBody = body];
cols = Max[Length[headerList], Length[#] & /@ useBody];
headings =
Map[StyleBox[#, FontFamily -> "Times", FontWeight -> "Bold",
FontColor -> RGBColor[0.5, 0, 0.3]] &, {PadRight[headerList,
cols, ""]}, {2}];
itemsBody = Join[headings, PadRight[#, cols, ""] & /@ useBody];
result =
AppendNotebook[result,
Cell[BoxData[
GridBox[itemsBody, GridFrame -> True, RowLines -> True,
ColumnLines -> True]], "Text"]];
Return[result]
]nb = writeNotebookGrid[nb, {{1, 2}, {2, 3}}, {A, B, C}]
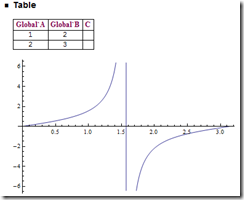
Which gives you a little table in your report like this:
Adding graphs to your plot is done like this:
The syntax is a bit fidly but will build you a notebook like this:ab = AppendNotebook[nb,
Cell[BoxData[ToBoxes[Plot[Tan[x], {x, 0, \[Pi]}]], ""],
"Text"]]; NotebookPut[ab]
The great thing is that once you have these primitives you can quickly iterate through large data sets and produce detailed reports. Especially if you spend some time on the graphs with annotations and labels. Mathematica 7 has improved legends over Mathematica 6.


No comments:
Post a Comment